Gnuplot: Difference between revisions
No edit summary |
(No difference)
|
Latest revision as of 21:59, 19 October 2017
Gnuplot is a portable command-line driven graphing utility for Linux, OS/2, MS Windows, OSX, VMS, and many other platforms.
I have been using Gnuplot for some of my antenna-range measurements using a GPS module and a microcontroller.
The way I use it on Linux, there are four files required to create a new plot:
- data file
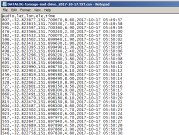
This is data in CSV (comma separated values) and the column numbers need to match what the Gnuplot script expects. A common format would be to have whatever you're measuring (e.g. signal strength, or voltage) in the first column, gps latitude and longitude in the second and third columns, maybe elevation in the fourth column, and gps timestamps (usually in UTC format) in the fifth column. But once you have closer look in the gps.gnuplot.txt script file you should be able to change this around. The columns in the script file are referred to as $1, $2, $3, etc..
- map image
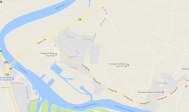
A map in .png format of the area that covers the range where GPS measurements were made. Although not strictly required for generic Gnuplot use, I used a bash script as a pre-processor to feed the coordinates as read from the map image's filename. This way no script files need to be edited, only the map image filename. The filename needs to contain the top-left and bottom-right coordinates in a specific order.
- plot-coverage-map.sh
This is a Linux bash shell script that will run some checks to make sure that the input files exist and that the coordinates are found in the filename. It also allows for adjusting the position of the data on the map if the coordinates don't exactly align. The script will scan the map image to get the dimensions and pass it on to gnuplot. The code for this file is shown below.
- gps.gnuplot.txt
The script that contains all the functions to combine the data and the map and produce the resulting plot image. It uses various variables that are fed from the bash script so that this file needs very little editing to make plots for different input files. The code for this file is shown below.
NOTE: you may need to swap the latmin/latmax or lonmin/lonmax values if you're in the northern hemisphere or west of Greenwich.
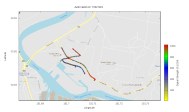
Example final image with the data plotted, legend, title and axis labels.
Since the data file and the map image are dependent on your preferences, I have only listed here the contents of the bash script and the gnuplot script.
plot-coverage-map.sh
#!/bin/sh

GNUPLOT=/usr/bin/gnuplot
PLOTFILE=gps.gnuplot.txt


# update these if the map coordinates don't exactly match the data.
# values are in 100,000th arc decimals and can go negative
ADJUST_LAT=0
ADJUST_LON=0


# range of data values.
VALUES_MIN=10
VALUES_MAX=1024

OUTFILE="measurements-plotted.png"


# -- shouldn't have to edit anything else below in this script --

if test $# -lt 2
then
  echo "Syntax: $0 <mapfile_latmax,lonmax_latmin,lonmin.png> <datafile>"
  echo
  exit 1
fi

if ! test -f $1
then
  echo "File not found: $1"
  exit 1
fi
if ! test -f $2
then
  echo "File not found: $2"
  exit 1
fi


# echo fetch coordinates from map file

LATMAX=`echo "$1" | awk -F _ '{print $2}' | awk -F , '{print $1}'`
if test -z $LATMAX
then
	echo "unable to get map Max Latitude, please check filename format"
	exit 1
fi


LONMAX=`echo "$1" | awk -F _ '{print $2}' | awk -F , '{print $2}'`
if test -z $LONMAX
then
	echo "unable to get map Max Longitude, please check filename format"
	exit 1
fi


LATMIN=`echo "$1" | awk -F _ '{print $3}' | awk -F , '{print $1}'`
if test -z $LATMIN
then
	echo "unable to get map Min Latitude, please check filename format"
	exit 1
fi


LONMIN=`echo "$1" | awk -F _ '{print $3}' | awk -F , '{print $2}' | awk -F . '{print $1"."$2}'`
if test -z $LONMIN
then
	echo "unable to get map Min Longitude, please check filename format"
	exit 1
fi
echo "Latmax: $LATMAX  Lonmax: $LONMAX"
echo "Latmin: $LATMIN  Lonmin: $LONMIN"

if test $ADJUST_LAT -ne 0
then
  echo "Adjusting Latitude by $ADJUST_LAT"
  LATMAX=`echo "scale=6;$LATMAX + ($ADJUST_LAT/1000000)" | bc`
  LATMIN=`echo "scale=6;$LATMIN + ($ADJUST_LAT/1000000)" | bc`
fi

if test $ADJUST_LON -ne 0
then
  echo "Adjusting Longitude by $ADJUST_LON"
  LONMAX=`echo "scale=6;$LONMAX + ($ADJUST_LON/1000000)" | bc`
  LONMIN=`echo "scale=6;$LONMIN + ($ADJUST_LON/1000000)" | bc`
fi


# get map file dimensions

IMG_WIDTH=`file "$1" | awk -F "PNG image data, " '{print $2}' | awk '{print $1}'`
if test -z $IMG_WIDTH
then
	echo "unable to get image width, please check output from 'file' command"
	exit 1
fi

IMG_HEIGHT=`file "$1" | awk -F "PNG image data, " '{print $2}' | awk '{print $3}' | awk -F , '{print $1}'`
if test -z $IMG_HEIGHT
then
	echo "unable to get image height, please check output from 'file' command"
	exit 1
fi
echo "dimensions: $IMG_WIDTH x $IMG_HEIGHT"


echo "create graph.."

if $GNUPLOT -e "width=$IMG_WIDTH"         \
	    -e "height=$IMG_HEIGHT"       \
	    -e "latmax=$LATMAX"           \
	    -e "lonmax=$LONMAX"           \
	    -e "latmin=$LATMIN"           \
	    -e "lonmin=$LONMIN"           \
	    -e "values_min=$VALUES_MIN"   \
	    -e "values_max=$VALUES_MAX"   \
	    -e "MAP_FILE='$1'"            \
	    -e "DATA_FILE='$2'"           \
	    -e "OUT_FILE='$OUTFILE'"      \
	    $PLOTFILE
then
  OK=1
else
  # some error occurred, keep the screen paused for a while longer
  sleep 2
fi

echo "Done"
The second file is the gnuplot script file that does the actual plotting of the data on the background image:
gps.gnuplot.txt
#!/usr/bin/gnuplot

reset

set key off

set term png size width,height

# Data is comma delimited
set datafile separator ","

set output OUT_FILE

set pm3d;
set pm3d map

# initially, disable the colorbox so it isn't generated with images and data plots
unset colorbox

# vertical ticks on the colorbox
set cbtics

set multiplot

set lmargin at screen 0.1
set rmargin at screen 0.85
set bmargin at screen 0.1
set tmargin at screen 0.9

set title "Enter a useful title here "

# -- define the data point colors on the map --

# option #1 - hand-pick two Hue values and let gnplot map the values to it
#h1 = 20/360.0
#h2 = 250/360.0
#set palette model HSV functions (1-gray)*(h2-h1)+h1,1,0.98

# option #2 - simple two-color linear gradient
#set palette model RGB defined ( 0 'red', 1 'blue' )

# option #3 - skewed towards higher values
set palette model RGB defined ( 0 'yellow', 600 'blue', 800 'green', 1024 'red' )


# -- plot the background map --
unset xtics
unset ytics
plot MAP_FILE binary filetype=png with rgbimage notitle

# -- plot the data on the map --

#           west      east
set xrange [lonmax:lonmin]
#           south     north
set yrange [latmin:latmax]


set xtics .01
set ytics .01
set xlabel "Longitude"
set ylabel "Latitude"
plot DATA_FILE using 3:2:1 notitle with points lc palette

# -- plot the color box --
set cbrange [values_min:values_max]
set cblabel "Signal Strength (0-1024)" offset 0.0,0.0
set zrange [0:1]
unset xlabel
unset ylabel
unset title
unset xtics
unset ytics
set colorbox vertical user origin 0.87,0.1 size 0.02,0.5
splot '++' u ($2):($3):(cos($2*$3)):($1) with pm3d

unset multiplot
For the background map I just use google maps and do a print-screen of an area. I then right-click on the map to get the coordinates and put those for the top-left and bottom-right corners of the image into the filename.


